j

Lorem ipsum dolor amet, consect adipiscing elit, diam nonummy.

Follow Us

Search

WellSchematic

Creating an Essential Fit-for-Purpose Tool for Engineers

Summary

Context

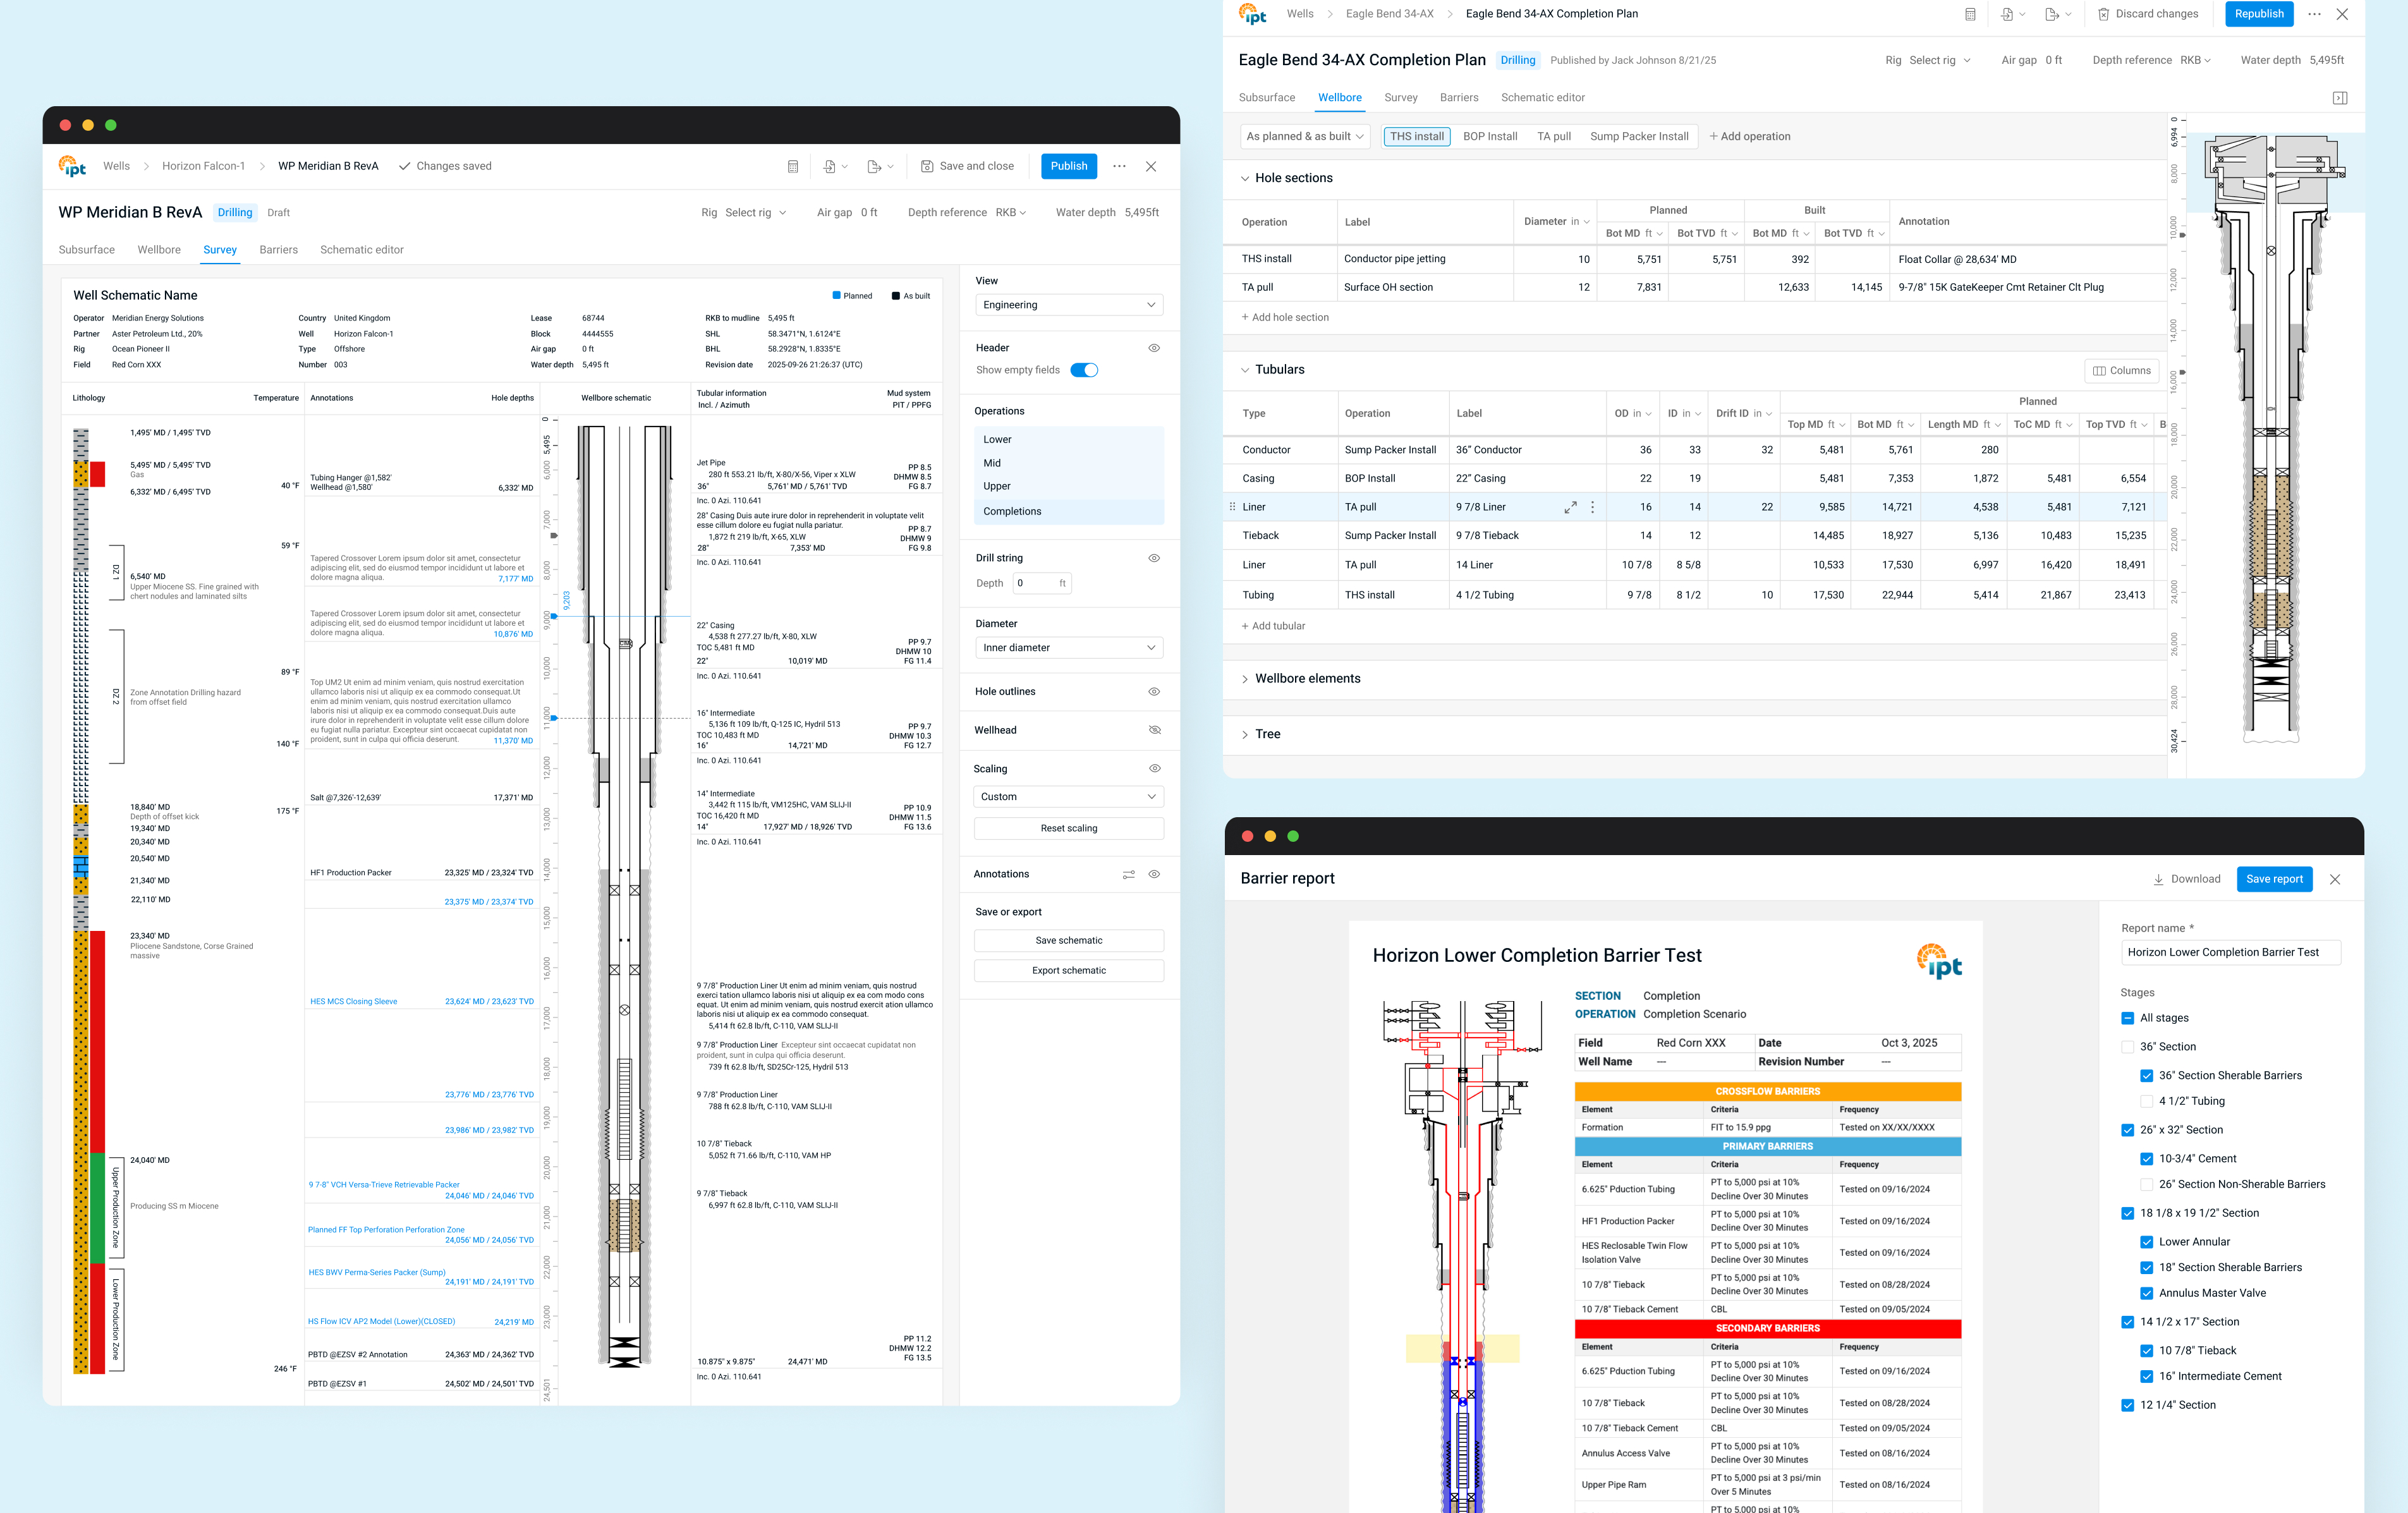
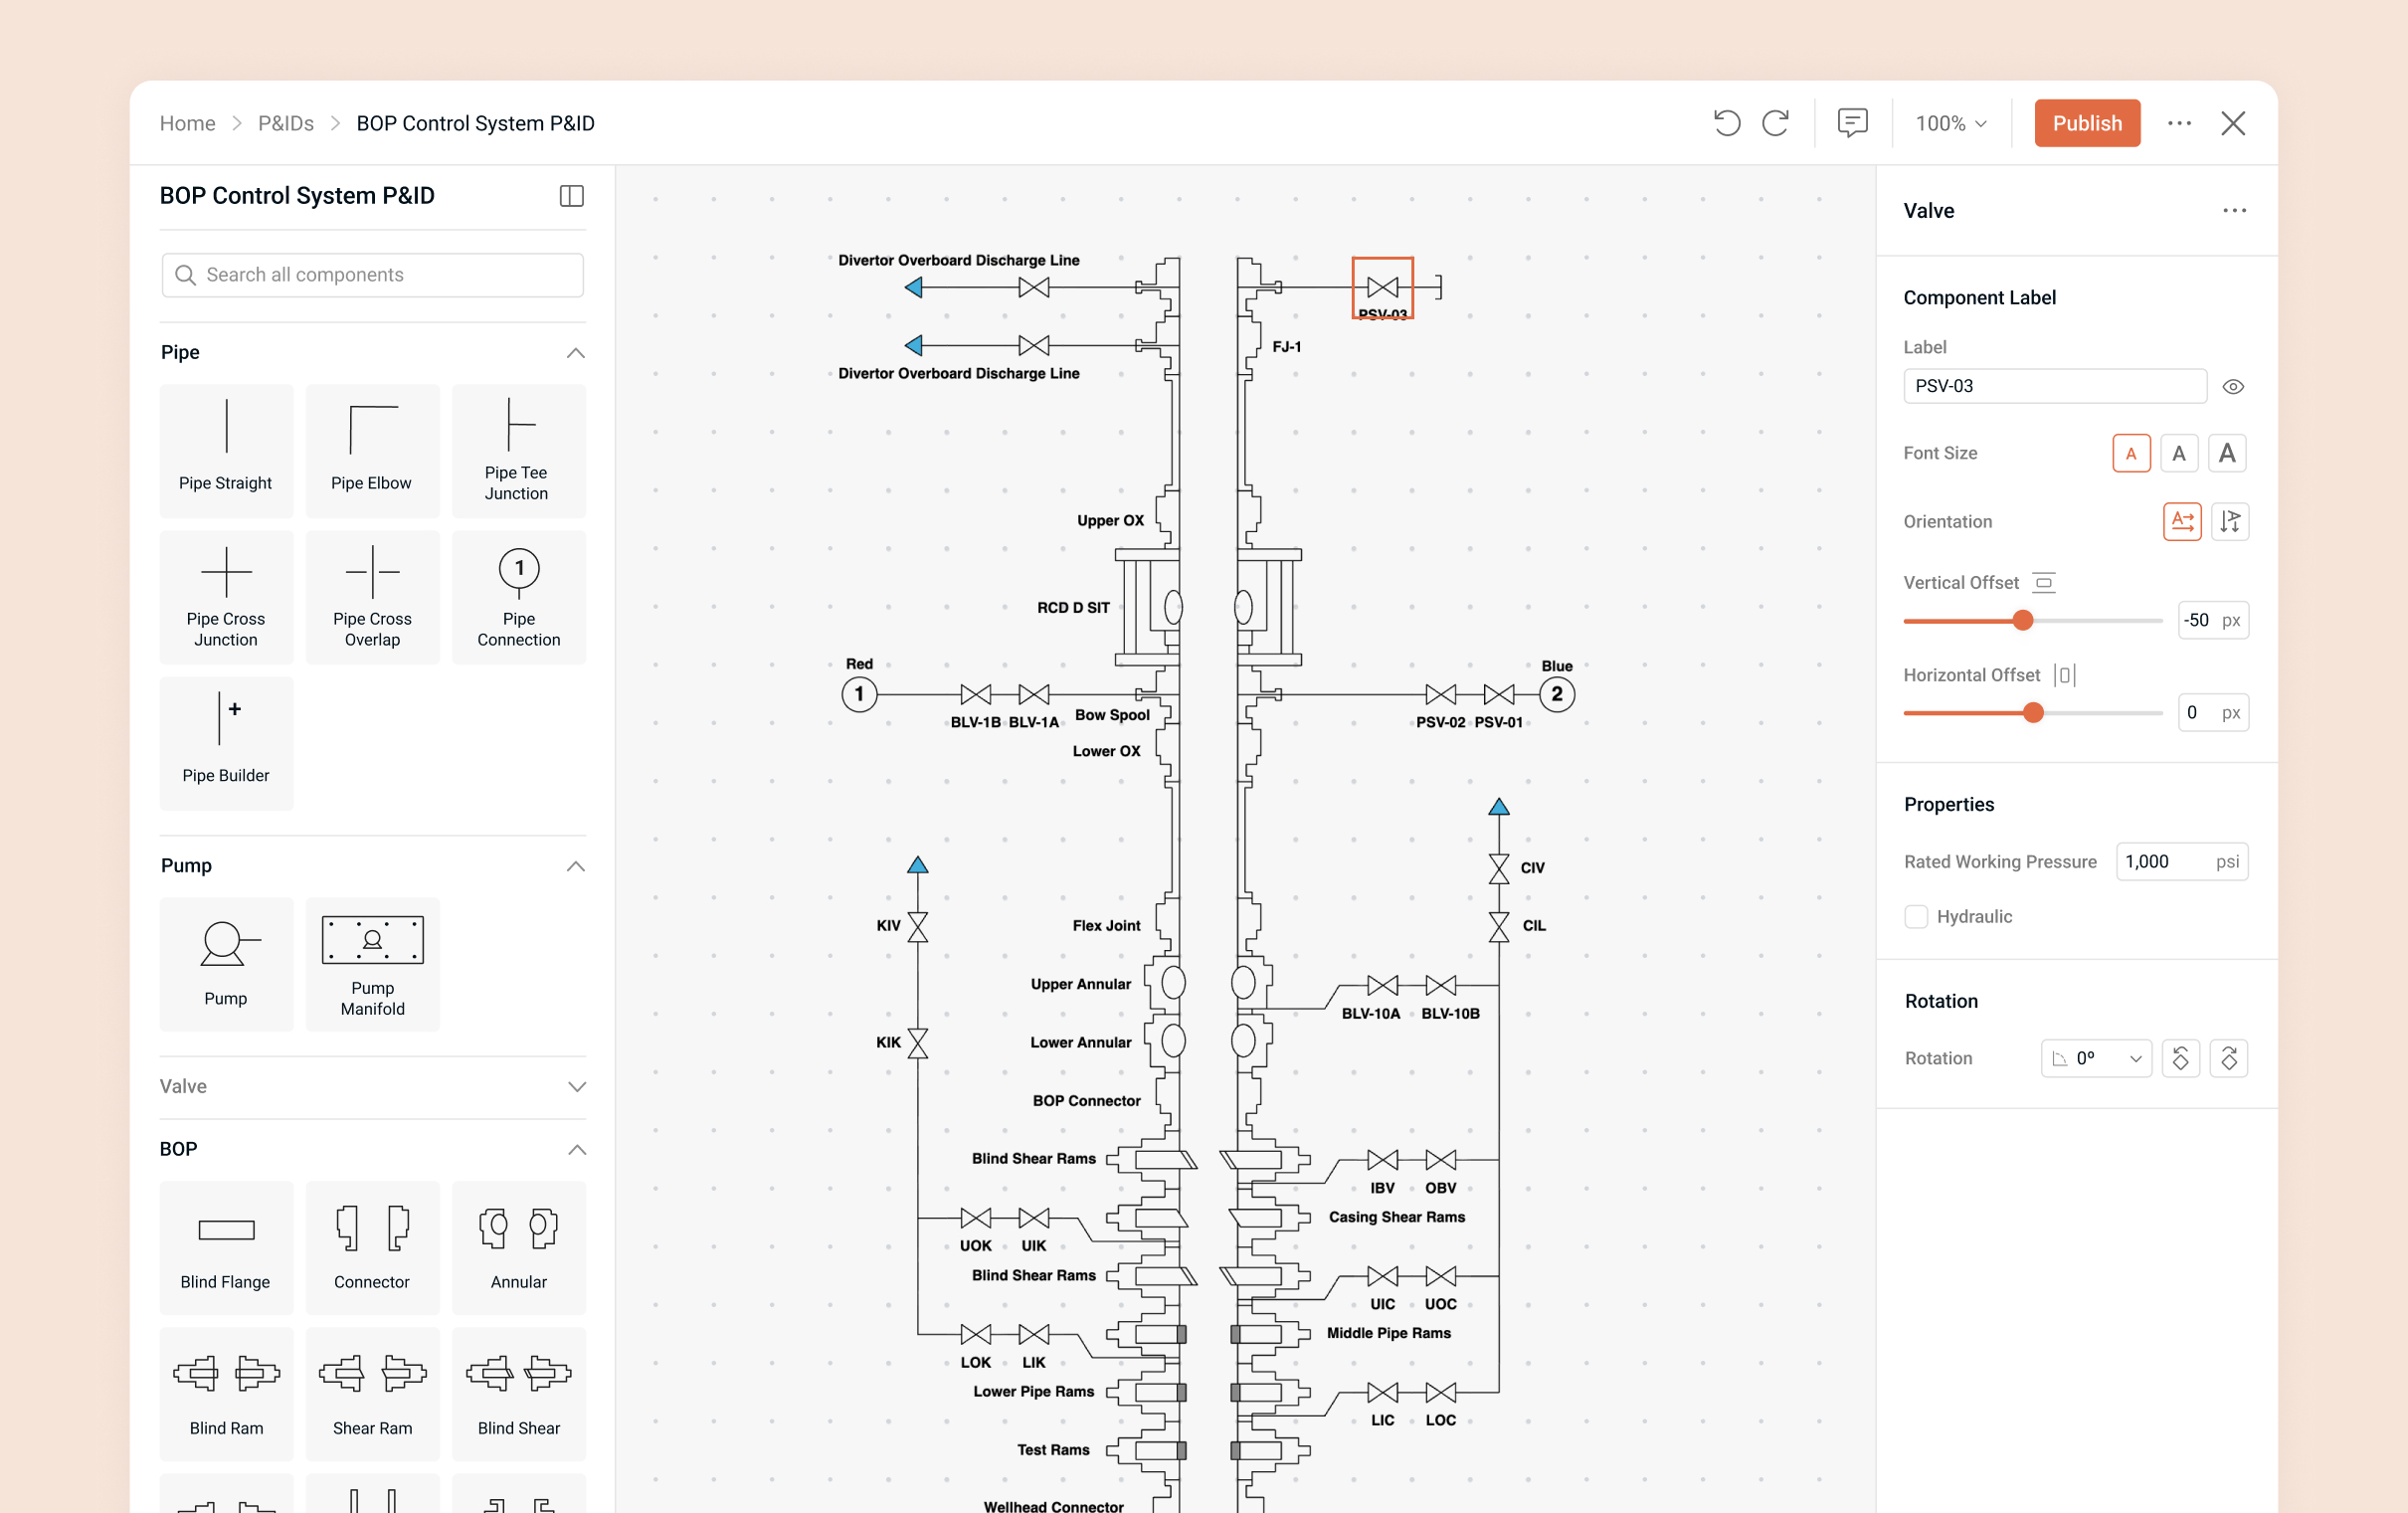
In the oil and gas industry, wellbore diagrams are essential visual references that represent the structure and components of a well. Engineers rely on them to support safe operations and informed decision-making. These diagrams also facilitate alignment across teams and disciplines by serving as a shared source of truth.

I was brought into this project to research how engineers were currently creating and managing these diagrams, identify inefficiencies, and design a fit-for-purpose tool that better supports their needs.

My Role

  • Led UX research and design strategy to develop a fit-for-purpose tool
  • Conducted interviews and discovery sessions with engineers and stakeholders from major oil and gas operators to understand workflows, needs, and pain points
  • Developed user flows, sitemaps, personas, and wireframes
  • Designed the beta product for user testing and early adoption
  • Collaborated cross-functionally with engineering, product, and leadership teams

The Problem

There was no standardized or efficient way for engineers to build or update wellbore diagrams. Instead, they relied on general-purpose software like PowerPoint, Excel, and Visio. None of which were designed for this purpose. The result was a fragmented process filled with pain points:

  • Diagrams were manually built using shapes, requiring design effort from users more comfortable with data than visuals
  • No shared templates, formatting rules, or unit conversions
  • No way to set and view the scale of diagram elements
  • Version control was poor, updates were lost or duplicated, and files couldn’t be shared or edited in real time
  • Diagrams couldn’t be customized for different stakeholders or easily integrated into other workflows

This presented an opportunity to design a user-friendly, fit-for-purpose tool. I designed a beta product focused on solving these pain points and streamlining one of the industry’s most essential tasks.

Discovery

I conducted interviews with a variety of roles involved in creating and using wellbore schematics to gain a holistic understanding of their workflows, usage, goals, and pain points. I developed user personas based on these insights and collaborated with industry experts to map user flows and outline a rough site architecture for the beta product. I also analyzed existing wellbore diagrams to identify common issues and inconsistencies, and reviewed industry materials to better understand the context.

Interviewing Users

As a first step in my research, I developed interview questions to understand various aspects of the wellbore diagrams and related workflows. I interviewed individuals across different roles from major oil and gas operators. These conversations helped me understand how they use wellbore diagrams, their needs, and the key pain points they face.

Interview Questions
Notes from various interviews

Key Insights from Interviews

Through conversations with a range of users, I uncovered recurring themes, common frustrations, and the areas most in need of improvement. Key insights included:

Schematics as a Universal Reference

  • Serve as a universal reference across teams and disciplines
  • Essential for cross-team communication and well documentation
  • Support critical operations like interventions and production workovers

Current Workflow

  • Reliance on Excel for flexibility, manually updating existing schematics
  • Data comes from multiple sources and is manually input
  • Process is iterative as new data arrives

Challenges

  • Time-consuming formatting and visualization with inconsistent standards
  • Poor version control causing outdated files and collaboration issues
  • Limited integration with other platforms
  • No easy way to customize views for different stakeholders

Desired Features

  • Centralized version control and collaboration
  • Customizable views for different users
  • Standardized yet flexible formatting and unit support
  • Integration with existing platforms and data sources

Personas

After gathering interview feedback and researching user roles and workflows, I developed provisional personas to capture the needs and behaviors of different roles.

Examining Existing Schematics

Everyone creates schematics differently, with no set standard. I reviewed numerous wellbore diagrams to analyze their structure, detail presentation, visual elements, and the inconsistencies and commonalities. I also examined the underlying data to understand how it translates into diagram components, collaborating with industry experts to clarify the significance and relationships of each element.

User Flow

In collaboration with industry experts, I mapped a user flow showing how engineers input information to build a wellbore schematic. This guided the structure of the product, ensuring it supported their workflows.

Site Architecture

I developed a preliminary sitemap with notes on the content for the beta product.

Design

The product was first developed as a beta version to test market response with the existing audience. The priority was ensuring the experience aligned with and enhanced users’ current workflows, ensuring the product delivered value. Styling was a lower priority at this stage, with the beta focused on functionality and workflow fit.

Wireframes

I created low-fidelity wireframes to quickly explore and visualize the application’s basic structure. These served as a visual reference to get early feedback and guidance from industry experts, the product team, and developers. The goal was to clarify direction, get the team aligned, and guide the product design.

Early Designs

After discussing the wireframes with the team, I used their feedback to create higher-fidelity mockups. I iterated on the designs, developed prototypes, and collected ongoing feedback, resulting in several rounds of refinement and collaborative discussion.

Beta Product

After multiple iterations and feedback cycles, we launched a polished, user-centered beta product ready for testing.

Streamlining Wellbore Diagram Creation

I redesigned the process of creating wellbore diagrams by generating them directly from data tables instead of manually arranging shapes. Engineers, who are more comfortable working with numbers, no longer needed to create and move shapes to represent components, a time-consuming process. Since wellbore data changes frequently, users could simply update the data, and the diagrams would automatically reflect those changes. When users hovered over a row in the table, the corresponding element in the diagram was highlighted in blue, making it easier to connect data with visuals.

This approach also made it easier for engineers to collaborate on plans, improving version control and standardization. We added data error notifications to inform users when data was inaccurate and highlight which values were off. Selecting an error took users directly to the cell that needed correction, making it quick and easy to fix issues.

Focused Component View

Users could expand a component row to open a drawer, allowing them focus on that component in detail and enter additional information. They could also add attachments directly to the component.

Enabling Data Integration & Compatibility

Engineers typically work with Excel, CSV, or JSON files, so we made the system even more compatible by enabling Excel import and export. Users could import Excel files, preview the data, select the cells to bring in, and automatically map columns to the corresponding fields in the system using the automap feature.

Additionally, users could select specific data to export for other uses, whether for sharing with colleagues or integrating with other applications and workflows.

Configurable Wellbore Schematics

Users could create tailored wellbore schematic views by choosing different templates, selecting which elements to display, and adjusting the wellbore scale. These customized schematics could then be easily exported and shared with stakeholders and colleagues.

Adding Value with Barrier Tools

Users could use the wellbore diagrams to create barrier schematics and barrier plans, a key workflow that adds significant value to the product. Previously, users would add barriers manually to their diagrams, often resulting in unclear visuals. With this feature, users could assign barriers, visualize them clearly, define testing criteria, and generate barrier reports directly from their plans, which could then be exported and shared efficiently.

Gathering Feedback

We used multiple methods to collect feedback on the beta version of the product. A dedicated feedback portal allowed users to submit suggestions and vote on others, and CTAs throughout the product encouraged participation. We also ran a pilot program, conducted UAT testing, and held focus groups and interviews with various clients. We selected internal team members to build various wellbore diagrams from real-world existing data to identify user experience improvements, bugs, missing features, and data gaps.

We strived to get the product in front of as many users as possible and analyze both their feedback and overall sentiment toward the product. All the feedback was organized, analyzed, and prioritized, informing improvements, fixes, and the addition of new features.

Post UAT survey questions
Pilot program assignment 1
Assignment 1 submissions
Pilot program assignment 2

Outcome

We took the feedback, prioritized the most impactful improvements, and made thoughtful refinements that enhanced the user experience. Through continuous collaboration, testing, and iteration, the beta evolved into a more intuitive, efficient, and reliable tool.